Artificial Intelligence: A Paradigm Shift in the Pharmaceutical Industry – Use Case of Cancer Detection

The current business model of the pharmaceutical industry where a new drug may take a decade and Billions of dollars to develop is no longer viable in this digital era of big data and cloud computing. Giant IT companies such as Amazon and Google are leveraging their deep pockets and strong Artificial Intelligence (AI) footprints to lower the entry barrier to this vital sector and render classical models of drug discovery and development obsolete.
Introduction
AI, particularly the Deep Learning field of it, can empower translational pharma research at each phase of drug development and discovery, starting from initial candidate selection phase with its aim of drug and target selection, up until phase III post launch with its aim of life-cycle management. Each phase in the drug discovery chart can be accelerated by developing and deploying accurate predictive models trained on relevant historical data. For example, modeling diseased human cells by varying the levels of sugar and oxygen the cells were exposed to, and then tracking their lipid, metabolite, enzyme and protein profiles is an area where AI and cloud computing can add value and save both time and money. Some of the pharmaceutical companies, including Novartis and AstraZeneca, managed to demonstrate impressive results on drug discovery and development by embracing AI in the last five years [1]. In the spirit of showing the benefits of AI and data analytics in pharmaceutical research, we present here the results of using a specific class of AI to detect Ovarian cancer.
Data collection and formatting
Data used in this study is courtesy of the Federal Drug Administration-National Cancer Institute, Clinical Proteomics Program Databank. Data consists of signatures of mass spectrometry on protein profiles of 216 patients including 121 patients with Ovarian cancer and 95 cancer-free persons used as control group in this study. Signature extraction and identification is performed using serum proteomic pattern diagnostics where proteomic signatures from high dimensional mass spectrometry data are used as a diagnostic classifier [2]. Profile patterns are generated using surface-enhanced laser desorption and ionization (SELDI) protein mass spectrometry [3]. The objective is to build a classifier to classify patients in one of two classes (i.e. cancer and cancer free) based on a limited number of features selected from SELDI data of studied samples.
Raw data is preprocessed and put in a 216 by 15,000 matrix. The 216 rows represent the number of patients out of which121 are ovarian cancer patients and 95 are normal (i.e. cancer-free) patients. The 15,000 columns represent the mass-charge values in M/Z where M stands for mass and Z stands for charge number of ions. M/Z (or simply |MZ|) represents mass divided by charge number and the horizontal axis in a mass spectrum is expressed in units of m/z. Each row in the data matrix represents the ion intensity level at a specific (one out of the 15,000) mass-charge values indicated in |MZ|.
Another 2 by 216 index matrix holds the index information to associate data samples with its appropriate class of patients. For instance, the first 126 elements of the first row of this matrix has the index value of “1” indicating its association with cancer patients, whereas the rest 95 elements of this first row are set to zero indicating its association with cancer-free patients. So, the reduced dataset of features that will be considered for this study is 216 by 100 matrix. Each column represents one of 216 patients and each row represents the ion intensity level at one of the 100 highest mass-charge values for each patient. A 3-D representation of this dataset is shown below in Figure 1.
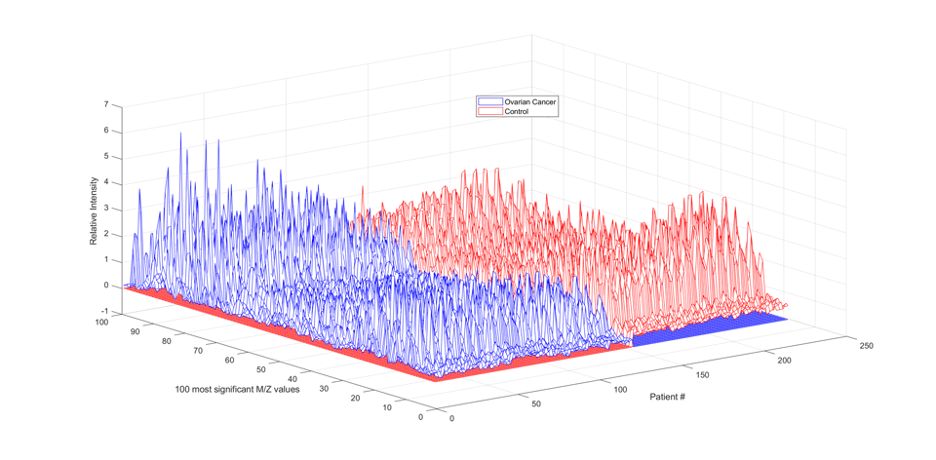
Figure 1: Ion intensity levels at the100 highest mass-charge values of the 216 patients
Classification Using a Feed Forward Neural Networks
Various clustering and classification techniques have been tested. We present in this section the results of classification using Feed Forward Neural Networks (FFNN), which is an important Machine Learning technique widely used in classification problems. The set of features identified in the previous section (i.e. highest 100 mass-charge values will) be used to classify cancer and normal samples. A 1-hidden layer feed forward neural network with 100 input neurons, 8 hidden layer neurons, and 2 output neurons is created and trained to classify data samples. Figure 2 shows the FFNN structure used in this classification study.
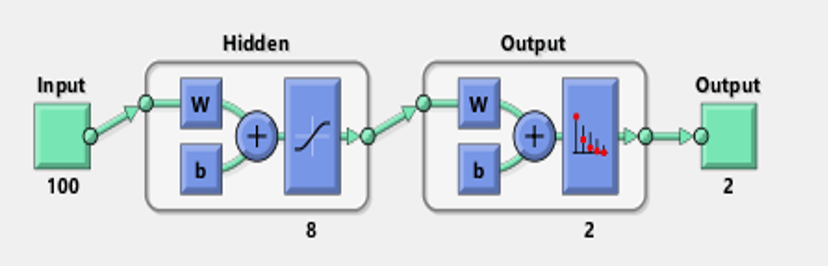
Figure 2: Feed Forward Neural Networks architecture used for classification
The input and target samples are automatically divided into training, validation, and test sets. The training set is used to train and teach the FFNN. Training continues as long as the FFNN performance is improving. Data is distributed over training, validation, and test sets respectively with 152 data samples (or 70% of the entire data set of 216 samples), 32 data samples (or 15%), and 32 data samples (or15%). The network performance on the test data set gives an estimate of how well the network will perform when tested with data from the real world. Figure 3 shows how the network’s performance improved during training using the well-known Scale Conjugate Gradient (SCG) algorithm. Note that training performance is improved by minimizing cross entropy loss function shown on a logarithmic scale. It rapidly decreased as the network was trained.
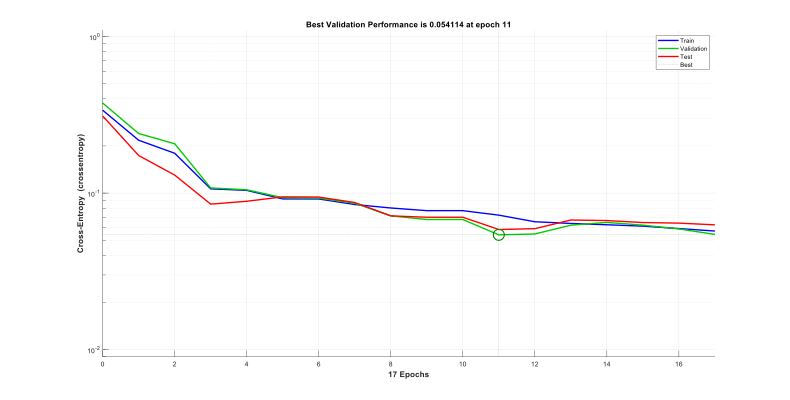
Figure 3. Training performance of the FFNN of Figure 2. Note that at training epoch 11, validation error was minimal; optimal network parameters are identified at such a training epoch
Classification Results
The trained neural network can now be tested with the testing samples that were partitioned from the main dataset. The testing data is excluded from training and hence provides an „unseen“ dataset to test the network on. One measure of how well the FFNN would perform is the confusion plot, also known as error matrix, to visualize the system classification accuracy as shown in Figure 4. Each row of the matrix represents the instances in a predicted class, while each column represents the instances in an actual class. The confusion matrix shows the percentages of correct and incorrect classifications. Correct classifications are the green squares on the matrix diagonal. Red squares represent incorrect classifications. Class 1 indicates cancer patients and class 2 indicates cancer-free patients.
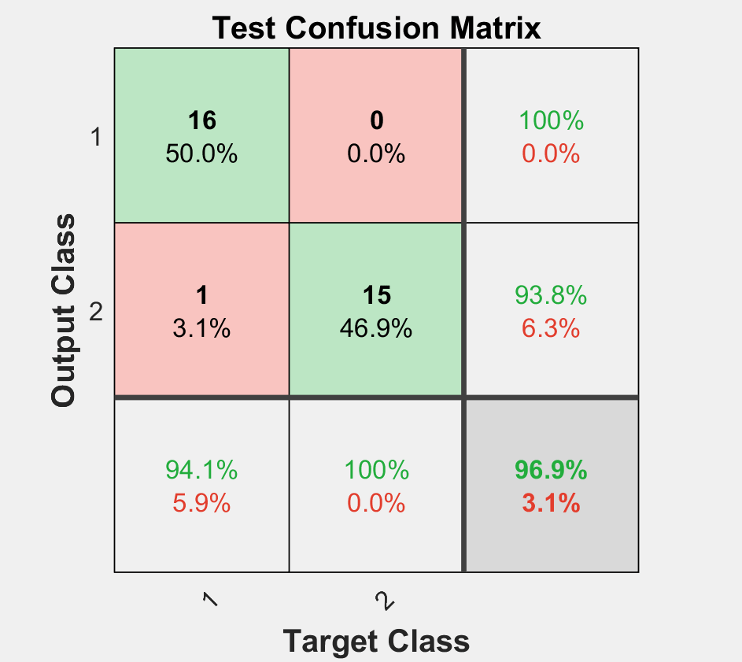
Figure 4. Confusion matrix showing the proposed FFNN classification performance on “unseen data before” with an accuracy exceeding 96%
Figure 5 shows another way of measuring the FFNN performance using error histogram across the three datasets (i.e. training, validation, and test). As can be seen, most of the instances resulted on smallest errors for the three types of datasets.
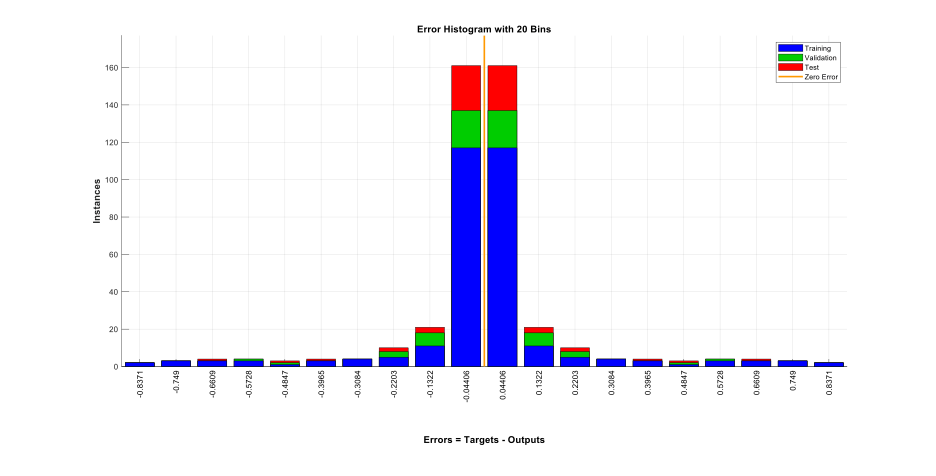
Figure 5. FFNN performance on the three datasets (i.e. training, validation, and test). Most of instances resulted on a small errors showing accurate classification .
Conclusions
In this study and based on the Ion intensity levels of 216 individuals including 126 cancer patients and 95 cancer free control group, a straight Feed Forward Neural Networks classifier showed excellent classification results approaching 97% accuracy. This use case study was just an example to show the promise of Artificial Intelligence (AI) in pharma R&D including drug discovery and drug development. Chronical diseases such as Alzheimer, diabetes, and cancer are expected to benefit from this new research paradigm in pharmaceutical companies built around AI and Cloud computing. We are excited to have its mission set on the promises and challenges of this structural transformation that is touching almost every field of the economy. With its resolute commitment to develop and deploy AI and Cloud computing to address real complex issues, we are looking forward to being an active part of this paradigm shift of digital transformation.
References
[1] Alex Zhavoronkov, „Deep Dive Into Big Pharma AI Productivity: One Study Shaking The Pharmaceutical Industry”, Retrieved from https://www.forbes.com/sites/alexzhavoronkov/2020/07/15/deep-dive-into-big-pharma-ai-productivity-one-study-shaking-the-pharmaceutical-industry/#b3cda10567d7
[2] T.P. Conrads, et al., „High-resolution serum proteomic features for ovarian detection“, Endocrine-Related Cancer, 11, 2004, pp. 163-178.
[3] E.F. Petricoin, et al., „Use of proteomic patterns in serum to identify ovarian cancer“, Lancet, 359(9306), 2002, pp. 572-577.
Related links
Artificial Intelligence and Machine Learning in the Insurance Sector
Predictive Maintenance in Aerospace – Innovative Use Cases
Trends in Data-Driven Internet of Things (IoT)
Das Potenzial von Daten durch Business Analytics voll ausschöpfen!
How to approach Business Analytics? A guide for better insights out of big data
The ROI of a Modern Data Strategy
Fachkompetenz Business Analytics
Fachkompetenz strukturelle Ausrichtung
Fachkompetenz Gesundheitswesen
About us
Our positioning and mission statement: “Mastering the Digital Age!” We are an integrated management and technology consulting group and offer the conception and implementation of holistic digitization solutions in an integrated manner. In combination, you will receive strategic advice from us on the digitization of your company from real thought leaders with profound methodological knowledge, extensive transformation experience from successful IT system integrators with many years of industry experience and a high level of technological understanding, as well as deep expertise in generating value from data – the new gold of the 21st century – with the help of the latest artificial intelligence (AI) and cloud computing technologies. All this End2End from a single source for the entire transformation process! Find out more about us here.
Did we spark your interest?
Are you facing similar challenges in your company? Do you have any questions about the case study described? If you are interested in an in-depth discussion, then write us an email or give us a call. We would be happy to present our consulting products and digital solutions to you in a personal discussion. We are looking forward to meet you!

Dr. Mokhtar Sadok
Partner, Business Analytics / Artificial Intelligence / Big Data Practice
Strategy & Transformation Consulting
Email senden
Kommentare geschlossen